Wednesday, 8 July 2009

Fun In The Sunglasses

The website, run by some good friends, is "Fun In The Sunglasses" and it has returned to the world wide web after some tecchnical difficulties.

So, if you want to get a good deal on some new sunglasses, from names including Porsche and Wimbledon, then the address is www.fitsunglasses.com.

Good news, in all.

Monday, 6 July 2009

Economics cycles

A wonderful graphic from the New York Times can be used to show what happens to growth in two dimensions:

x-axis: growth over the past 6 months (extremes show sharp swings in output, or sudden drops).
y-axis: annual growth - long term trend (actual rate of decline in the economy).

Looking at that version of things, everything will be fine.

However, and this point was missed by the Economist's Free Exchange, this graphic suffers the same flaw as did the option-pricing model of Long Term Capital Management. That flaw, is that it only takes into account recent recessions, and so is unable to correctly predict the current, more serious one.

In other news, the markets have lost their shine (perhaps I'll post again on them, but not today).

Thursday, 18 June 2009

Krugman's recent lectures

Paul Krugman made a tour of Europe recently, and gave the "Robbins" lectures at the London School of Economics.

His first lecture is available here (audio and slides).
His second lecuture is here (audio and slides).
His third and final lecture is here (audio and slides).

All links taken from his blog, but oddly, not from the same posts. As an indication, the first lecture is 76 minutes long.

Sunday, 7 June 2009

Market moves 1-5 June 2009

The pound reached 7 month highs against the dollar and the Euro, before falling away towards the end of the week (the BBC suspected it was the political instability here, I'm not convinced).

Anyway, the bare facts are below:

FTSE: 4438.56 (up 20.62 or 0.47% in 1 week, 25.71% in 13 weeks)
DOW: 8763.13 (up 262.80 or 3.09% in 1 week, 32.23% in 13)
£/$: 1.5982 (down 2.06¢ or 1.27% in 1 week, up 13.43% in 13)
£/€: 1.1440 (up 0.04¢ or 0.03% in 1 week, 2.71% in 13)

Oil in $: 68.37 (up $2.63 or 4.00% in 1 week, 56.35% in 13)
Oil in £: 42.78 (up £2.17 or 5.34% in 1 week, 37.84% in 13)
Oil in €: 48.94 (up €2.50 or 5.38% in 1 week, 41.57% in 13)

Gold in $: 962 (down $13 or 1.38% in 1 week, up 2.78% in 13)
Gold in £: 601.93 (down 68p or 0.11% in 1 week, 9.39% in 13)
Gold in €: 688.60 (down 54¢ or 0.08% in 1 week, 6.93% in 13)

All the usual good news signals, except that the pound fell against the dollar (or rather, the dollar rose against the Euro and pound, perhaps indicating a shift in perceptions as to the consequences of recovery on the value of the dollar in the longer term).

It is notable that the oil price and stock markets have shifted far more than gold and the currencies have. That gold hasn't fallen proves that many aren't convinced that "everything is going to be okay" but demand for oil is recovering, which means that the restrictions put into place by OPEC (to limit the oil price collapse) will start to bite.

World Cup Qualifying

Today, England beat Kazakhstan by 4 goals to nil in central Asia, in an attempt to qualify for next summer's world cup in South Africa. On Wednesday they will beat Andorra by a similar margin, unless a flying pig stops the match, or something similarly implausible happens.

Why do I mention this, here on an Economics-based blog? Basically it is because I think the excercise was a waste of money. UEFA (the European football association) has been allocated 13 places, which are awarded to the winners of 9 groups, plus the 4 winners of playoffs between the runners up.

Given that there are 53 clubs in "Europe" (including Kazakhstan, Turkey and Israel, who choose Europe over Asia as their tournament of choice), it seems obvious to me that there should be some 2-stage process to whittle down the candidates and reduce the required number of games.

If the 24 weakest sides (decided by the UEFA coefficient, which is based on performances over the past few years) were to play a tournament during the same summer as the main European Championships and World Cups (that is, every even numbered summer) then the 18 weakest sides could be eliminated, reducing the field to 35 sides.

These could then be allocated into 6 groups of 6 each playing 2 matches, with the top 2 going through, reducing the chance of the "big money" teams failing to qualify (not that it saved England, who finished 3rd behind Croatia and Russia in 2007-8 qualifying for the European Championships of 2008).

The advantages:
  1. Fewer matches like England-Andorra or Germany-San Marino, resulting in fewer confidence sapping trouncings for the "minnows".
  2. More chances for the minnows to beat each other, allowing them victories in competitive matches, which will teach them much about how to beat the better sides (or at least, the in between teams).
  3. A competition that teams don't want to enter, but do want to win. If the prize of getting one of the 6 "bonus" places involves home- and away matches against 2 of Europe's 12 best sides (given UEFA seedings, one of the top 6 and another ranked 7-12 would appear in each group).
  4. Fewer journeys to more dangerous places for many of Europe's spoiled élites. Many of the less politically stable members, would be the same teams who struggle to get through this tournament, earning a double bonus.
  5. Fewer international matches, reducing the pressure on TV companies to find time in their schedules for ever more football. Already many complain of over-exposure, yet some competitive England matches are only shown on Setanta. This sort of procedure would cut 1-3 matches per year from the schedule, depending on the procedure chosen.

The downsides, as I see them:

  1. Fewer matches of the style Andorra-England. The value of this fixture is much greater to the Andorran federation than it is to England, but I still feel that they should have to earn this bonus.
  2. A tournament hardly anyone will watch. According to Wikipedia, the 6 teams who would be seeded to survive the tournament would be Latvia, Hungary, Lithuania, Slovenia, Wales and Northern Ireland. Of the other teams, I can only remember Macedonia giving a major country a hard time.

All told, I believe the benefits outweigh the costs, and have the added bonus of reducing the number of meaningless fixtures in far-flung places that fans would be mad to bother with.

To be sure, the number of European sides who qualify for tournaments does vary, and so does the qualifying method. Here is my simple guide to the more recent numbers:

12: 6 groups of 6, 2 from each qualifying. Teams come from 6 pots, with pot 1 being teams 1-6 by ranking, pot 5 being teams 25-30 and pot 6 the 6 "winners" of the minnows tournament.

13: as above, but with the 3rd placed teams competing for the final position (perhaps the 2 or 4 teams that come closest should playoff for the place)

14: 7 groups of 5 teams, 2 from each qualifying. Teams come from 5 pots, the first holding teams 1-7 by ranking, the 4th teams 22-28 and the final point consisting of 7 teams that survive a minnows tournament of all teams ranked below 29.

15 (European championships, minus host): as 12, except that the 6 3rd placed teams should playoff for the spare places.

22 (newly expanded Euro 2016 of 24, minus host and holder or 2 hosts): 11 groups of 5, with 2 qualifying from each. This would not require a preliminary minnows tournament, unless the number of UEFA countries expanded beyond 57 (and even then, perhaps only the very weakest would need to compete).

23 (24 team Euro 2016 minus host): 10 groups of 5, with 2 qualifying from each. 10 clubs to earn appearance in qualifying from all countries ranked outside top 40. Remaining 3 qualification spaces to be determined by best 3rd place sides, perhaps with playoffs to distinguish between them. It should be noted that the holder of the European Championship has never previously been granted automatic qualification, so this is the most likely number of qualifications spaces that will be up for grabs in 3 tournaments time.

Saturday, 6 June 2009

Understanding progress

Brad DeLong shares, via his blog, this exposition of economic history. The approach is to investigate average earnings per head across the past 800 or so years, and to find tipping points, where a genuine shift in the pre-existing correlation exists.

In a so-called Malthusian economy, named after Thomas Robert Malthus, the income of most individuals is determined by the land at their disposal, so any technology that enables land to be more productive, leads to more people being supported, and thus lower per capita income.

Page 10 of the pdf shows the historic relationship between population and income (working class real wages) and the break that occured in the mid-17th century. Curiously, the same figure doesn't appear on the graph on the next page, which shows income against time. This latter graph shows a peak during the wars of the roses and Henry VII's reign, which wasn't matched again until the age of Karl Marx, 100 years after the Declaration of US Independence or the publication of the Wealth of Nations.

The other key tale told is about the value of these 'real' numbers on income. Page 24 shows a table, demonstrating the number of man-hours (or more precisely, the multiple of an average earner's wage) required to purchase a variety of items. A single-speed bicycle, for instance, costs under 3% of what it did in 1895, by that metric. A silver spoon, however, costs more.

There then follows a vital desciption of the importance of substitute goods. The cost of live music in a middle class household has fallen from 2400 hours for the piano, plus however long is required to train, to a couple of hours, to buy an iPod with speakers. The key paragraph (in my view) is this one (with emphasis added by me):


Thus perhaps the most important component of the past century’s economic growth is the new commodity component—the goods and services of which people alive in the 1890s could dream but not purchase. Whenever we hear a sentence like “average GDP per worker in 1890 was equal to some $15,000 at 2008 prices,” we cannot help but think that the material standard of living then was about what we could obtain now if we had $15,000 to spend. But it was not. The simple valuing of the past’s production at the present's prices leaves out a very important part of the picture: the material standard of living then was about what we could obtain now if we had $15,000 to spend, but were required to spend it all on commodities that have been around for more than a century: no modern entertainment or communications or transportation technologies; no modern appliances; buildings, roads, bridges, and other infrastructure built using century-old technologies. And an income of $15,000 that must be spent exclusively on late nineteenth-century commodities is, for most of us, worth a lot less than $15,000.

Sunday, 31 May 2009

Markets 25-29 May 2009

A less dramatic version of last week's news, with small increases in everything (except oil, which continued its rise). Here are the figures, comparing Friday's close with the close a week earlier. I also include the last weekend when each indicator was last higher (this will differ from the data quoted on news channels, as they will use minute-by-minute data for comparison, not weekly).

FTSE: 4417.94 (up 42.65 or 1.21%) - was higher on 10/05/2009 (3 weeks)
DOW: 8500.33 (up 223.01 or 2.69%) - was higher on 10/05/2009 (3 weeks)

£: $1.6188 (up 2.68¢ or 1.68%) - was higher on 02/11/2008 (30 weeks)
£: €1.1436 (up 0.67¢ or 0.59%) - was higher on 08/02/2009 (16 weeks)

Oil: $65.74 (up $5.11 or 8.43%) - was higher on 02/11/2008 (30 weeks)
Oil: £40.61 (up £2.53 or 6.63%) - data not available before 7/12/2008 (25 weeks)
Oil: €46.44 (up €3.14 or 7.26%) - data not available before 7/12/2008 (25 weeks)

Gold: $975.5 (up $15.75 or 1.64%) - was higher on 22/02/2009 (14 weeks)
Gold: £602.61 (down 25p or 0.04%) - was higher last week, lower 3 weeks ago
Gold: €689.14 (up €3.75 or 0.55%) - was higher on 29/03/2009 (9 weeks)

That both the £/$ and Oil/$ exchange rates are at 30-week highs is no coincidence. Next week, I will compare prices with 13 weeks earlier, since that marks 3 months since the "rally" began in the markets.

Thursday, 28 May 2009

Monday, 25 May 2009

Markets: 18-22 May 2009

A delayed post, but this tracks movements between Friday close (15 May) and Friday close (22 May). Major movements were on currencies rather than stock markets.

FTSE: 4365.29 (up 17.18 pts, 0.40%)
DOW: 8277.32 (up 8.68 or 0.10%)
£: $1.592 (up 7.41¢ or 4.88%)
£: €1.1369 (up 1.28¢ or 1.14%)
Oil: $60.63 (up $4.56 or 8.13%)
Oil: £38.08 (up £1.14 or 3.10%)
Oil: €43.30 (up €1.77 or 4.27%)
Gold: $959.75 (up $30.25 or 3.25%)
Gold: £602.86 (down £9.50 or 1.55%)
Gold: €685.39 (down €2.96 or 0.43%)

Put simply, the dollar fell dramatically, but the stock markets were unfazed. Of course, in dollar terms, the FTSE rose over 5%, but since that isn't how it is measured, it doesn't get mentioned in the news (in £ terms, the DOW fell over 4.5%).

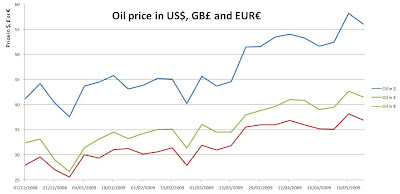
My point about oil price shifts being less dramatic when measured in pounds remains true.

Saturday, 16 May 2009

Markets 11-15 May 2009

Bad news this week, but not on the scale we became accustomed to over the winter. Below are listed the Friday closing levels of several markets, and a comparison with their levels one week earlier - designed to eliminate "noise" from daily data you might hear on the news).

FTSE: 4348.11 (down 113.98 pts or 2.55%)
DOW: 8268.64 (down 306.01 pts or 3.57%)

£: $1.5179 (down 0.51¢ or 0.33%)
£: €1.1241 (up 0.73¢ or 0.65%)

Oil: $56.07 (down $2.12 or 3.64%)
Oil: £36.94 (down £1.27 or 3.32%)
Oil: €41.52 (down €1.15 or 2.69%)

Gold: $929.50 (up $22.50 or 2.48%)
Gold: £612.36 (up £16.82 or 2.83%)
Gold: €688.35 (up €23.26 or 3.50%)

In italics is the only measure that doesn't match the glum mood. Stock markets rise with good news, as does the pound (perceived as more vulnerable to a struggling world economy) and so does oil (implied increased demand) whereas gold falls (implied decline in instability).

Below is a graph which I hope demonstrates the correlation between oil and the pound. See how, especially over the past two months, the oil price as measured in pounds is more stable than the others.

Nothing British

There's nothing British about the BNP. Their desire for a 99.9% white British society greatly conflicts with Britain's clearly observed love of Gurkhas and various other non-white groups (from footballers to singers to actors or even for Barack Obama).

Why is it that we find ourselves in a position where we expect some BNP leaders to enter the European Parliament?

Any region that elects a BNP MEP is a region I don't want to live in. Help me stay in the country (!) when you vote on June 4th.

Wednesday, 13 May 2009

A solution

El Pais has the solution:

"I'll count to three, and when you wake up, you won't remember anything that's happened, and you'll go back to buying houses and investing in the stock markets." (Own translation).

Saturday, 9 May 2009

Markets 4-8 May 2009

A good week on the markets as confidence begins to return.

FTSE: 4462.09 (up 218.87 or 5.2%)
DOW: 8574.65 (up 362.24 or 4.4%)
£: $1.5230 (up 3.19¢ or 2.1%)
£: €1.168 (down 0.71¢ or 0.6%)
Oil: $58.19 (up $5.77 or 11.0%)
Oil: £38.21 (up £3.05 or 8.7%)
Oil: €42.67 (up €3.16 or 8.0%)
Gold: $907 (up $22.5 or 2.5%)
Gold: £595.64 (up £2.35 or 0.4%)
Gold: €665.09 (down €1.59 or 0.2%)

Big increase in the price of oil (sign of confidence), in the UK stock market (given that, in dollar terms it went up almost 7.5%) and several other indicators of economic well-being.

Despite this, you cannot say the worst is over. A similar rally occured in 1931. Only time will tell when this is over, but last week was 4th in a row where the FTSE rose, and the 8th in 9. Fear is passing, perhaps giving the current market levels a better scale of realism, as the "panic" of February seems to pass. Of course, come June, we might find a different story.

Thursday, 7 May 2009

ECB still throwing stones

Imagine this crisis as a plane bombing the global village (which here is represented by an actual village). It approached the US first (I guess their house overlooks the town from the side from which the bomber approached, but that isn't important), and they threw everything they could at the situation, starting with dramatic cuts in interest rates (from 4.75% in September 2007 to 0-0.25% in December 2008, where it has remained ever since). It is not zero precisely due to technical difficulties with maintaining rates at that value (what they set is a target rate). They have since bailed out the banks (TARP, TALF and various other programs) culminating (or perhaps not) with the stress tests that most of the leading banks passed, according to reports today. They also had a massive stimulus bill in their budget, acting as a boost the economy. This, in my metaphor, amounts to firing every available anti-aircraft weaponry at the plane.

In Britain, we were slower to acknowledge the threat. In July 2007 rates were raised to 5.75% and only started dropping in December 2007, finally reaching 0.5% in March 2009. We lead the way on "saving the world........'s banks" and also had a "stimulative" budget, running a whopping 12% deficit for two years. This amounts to using all available anti-aircraft weaponry, except starting with lower stocks. Consider also that Gordon Brown did much of the shouting about the peril we were all in.

In Europe, they are still throwing stones. The ECB started cutting rates in October 2008 from 4.25% and are STILL cutting, and in a position to cut rates. Today they went from 1.25% to 1%. Given that European economies are suffering every bit as much as British and American ones, it beggars belief that the ECB hasn't done more, sooner. Euro-zone governments have been less forthcoming in their stimulus packages too, although in Ireland's case it is because potential lenders won't give them any money. They must be assuming that the Americans, Brits or possibly the Japanese, Chinese or others will shoot this plane down for them. Put simply, they aren't doing their bit to help defend us all from a decade of penury.

Tuesday, 5 May 2009

Cameron campaigns for BNP

Cameron urges 'vote for change'
"enough is enough"; tell Gordon Brown "what you think of him"; "letting our politics descend into a quagmire" and a few other incendiary quotes are listed in the BBC article.
Audio is available here

Monday, 4 May 2009

Why printing money doesn't necessarily cause inflation

Paul Krugman, most recent Nobel laureate for Economics, shows on his blog a lesson from Japan on how increasing the money supply, even by very large amounts WILL NOT CAUSE INFLATION IN A LIQUIDITY TRAP. The key graph I'll include below.

Whilst during a period of inflation, such a monetary expansion would have made things much worse, in a situation like Japan's since 1990, or the Western world's since last summer, it is all you can do to prevent massive, destructive deflation.

As ever, the Onion knows the way forward

Nation Ready To Be Lied To About Economy Again

Includes such gems as:
"[A]n overwhelming majority of citizens said they believe that, during these
extremely uncertain times, our leaders have a responsibility to come
together,
sit the American people down, and lie through their teeth about
everything from
misappropriations of taxpayer dollars to the severity of the
credit crisis."

Or,
""Please, treat me like a child. Treat me like a five-year-old," Sacramento
resident David Cooke, 64, wrote in a letter to Congress."

This will almost certainly be quoted by other, more respected Economist bloggers. I'll edit this post to link to them, then.

Sunday, 3 May 2009

Toxic assets

Sorry, but it had to be done.

Saturday, 2 May 2009

News this week

Using various websites' "most popular" function, I'm looking for a good news and a bad news article from each site.

BBC World News:
Good: umm, "World moves to contain swine flu" has the most positive sounding headline of the "most viewed" over each of the past 5 days.
Bad: "Car attack on Dutch royal parade"

Guardian website most viewed:
Good: Revolutionary Espresso Book Machine launches in London
Bad: Southampton will fold in eight days without a buyer

NY Times most emailed:
Good: After 341 Years, British Poet Laureate Is a Woman
Bad: Personal Health: Paying a Price for Loving Red Meat

Economist Most Read:
Good: The American economy: Better than it looks?
Bad: Chrysler: End of the road

To be clear, these aren't all the "top" story on each list, but are chosen to represent as many different stories as is reasonable, using the top 5, top 10 or whatever the website offers. Swine flu dominates all of the lists, obviously.

Markets this week

Swine flu became a global obsession, it was announced that the US economy was still shrinking faster than 6% a year (meaning it is currently about 3.3% below its peak) and as ever there was much bad news all around.

None of it appears to have surprised the markets, however. Here's the current levels and their change on a week earlier.

FTSE: 4243.22 (up 87.23, or 2.1%)
DOW: 8212.41 (up 136.12 or 1.7%)
£: $1.4911 (up 2.39¢ or 1.6%)
£: €1.1239 (up 1.56¢ or 1.4%)
Oil: $52.42 (up 76¢ or 1.5%)
Oil: £35.36 (down 6p or 0.2%)
Oil: €39.51 (up 49¢ or 1.3%)
Gold: $884.5 (down $23 or 2.5%)
Gold: £593.19 (down £25.34 or 4.1%)
Gold: €666.68 (down €18.83 or 2.7%)

Interestingly, the movement in the DOW and the £/$ exchange rate have been remarkably similar of late. If the DOW were measured in £ terms, it would lie 11.3% below it's 03/01/2009 peak, compared to 11.4% last week, 11.5% the week before and 11.2% three weeks ago. This is a highly unusual correlation, but implies that any optimism about the US economy either weakens the dollar or strengthens the pound. It also means that in any common currency, the FTSE has outperformed the DOW recently. Graph below, of both indices, quoted in £, rebased so that their recent peak is set at 100.